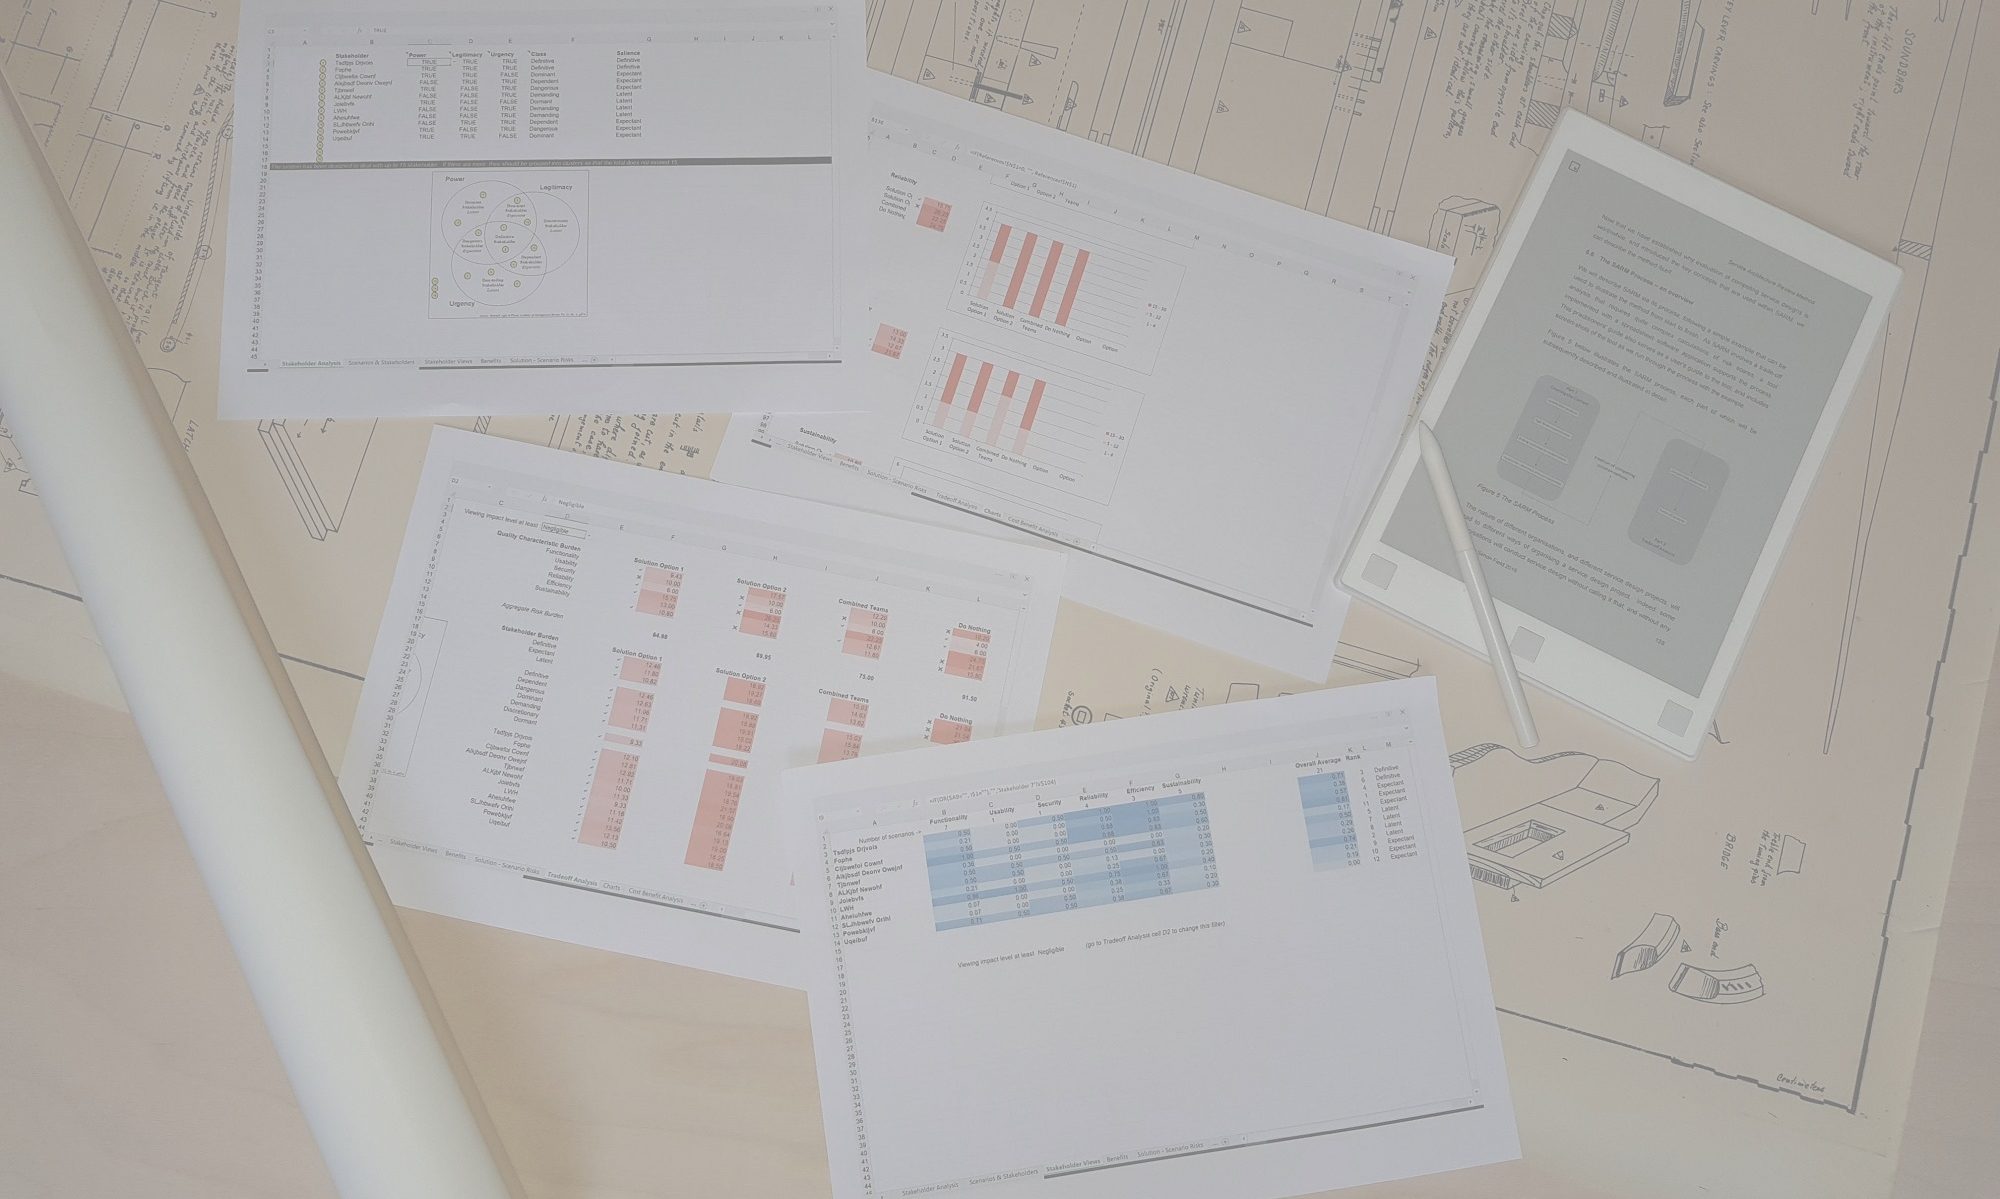
This tab presents the risk table that lies at the heart of SARM’s risk trade-off analysis. A traditional risk matrix is presented, with risk likelihood on the vertical axis and risk impact on the horizontal axis. The body of the matrix presents the product of the two, representing risk exposure. The cells are classified by colour: red, amber or green, based on their risk score.
The user can edit and change the following aspects of the model by directly changing the contents of the corresponding spreadsheet fields:
- The names of the two dimensions representing Likelihood and Impact.
- The five numeric values associated with each of the two dimensions
- The text descriptions of each of the numeric values
- The threshold that classifies a risk score to be red
- The threshold that classifies a rik score to be green
The model is thus sufficiently customisableto enable an organisation to recreate their corporate risk model, provided it adopts the familiar 5 x 5 matrix.

