This is where the team gets to see the final output of the SARM process. Ideally, it is part of a collaborative workshop that has just completed the previous activity, and can be viewed, considered and discussed by the project team and their most important stakeholders. Because it is an exploration of the outcome, each instance of this activity is likely to be different, and follow a different course. Questions will be asked, and many of the answers are likely to be found on the ‘Tradeoff Analysis’ tab of the SARM spreadsheet tool.
An example of this is given below:
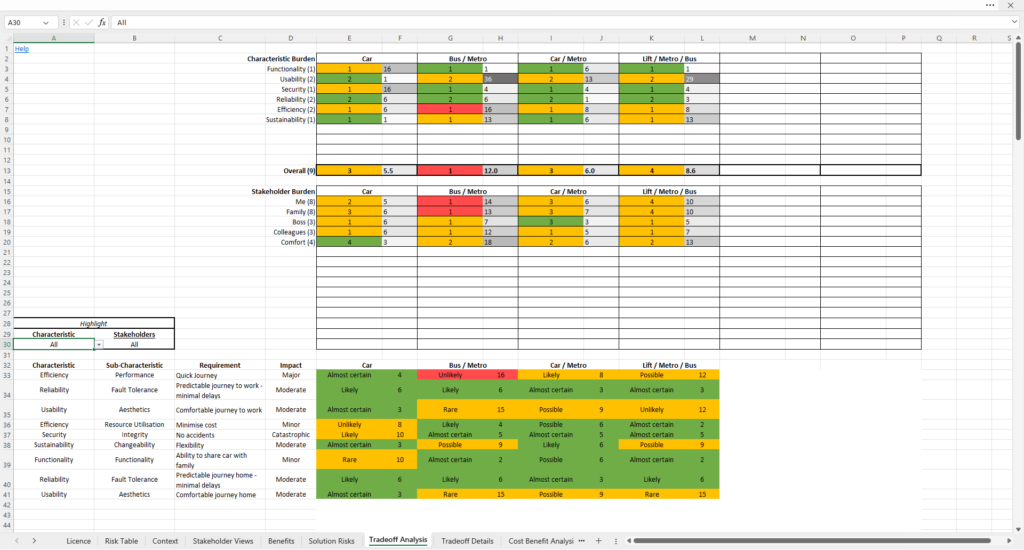
In this example, four competing solution options are being evaluated. The top part of the worksheet shows an analysis of the risks associated with each option from the different perspectives of the quality characteristics and the stakeholders.
Quality Characteristic perspectives
The RAG coloured cells indicate the number of ASRs that fall into a particular risk category in the risk table. If the cell is coloured red, the number indicates the number of ASRs that are equal to or above the Red risk score threshold in the Risk Table. If the cell is amber, the number indicates the number of ASRs that fall within the amber band on the Risk Table, and if green, then it indicates that all of the ASRs are green on the Risk Table.
The number that immediately follows each coloured cell, with a gray-scale colouring, is a score that represents the aggregated risk profile of all the relevant ASRs. It is a logarithmic scale with a range of 1 to 100. A score of 100 would represent that all the relevant ASRs have the worst possible risk score. This combination of colour, numbers and aggregate profile allows the user to quickly assess how many serious risks there are among ASRs for each characteristic, and what their overall total risk is: giving a view of both risk extent and distribution. The Overall row follows the same scoring model.
A similar view, but breaking down each Quality Characteristic into its constitiuent sub-characteristics, is available in the Tradeoff Details tab of the spreadsheet.
Stakeholder perspectives
Below the risk scores by quality characteristic you can find similar information but showing the perspectives of the individual stakeholders. This might help you determine whether any one solution might favour one group of stakeholders at the expense of others. And an exploration of this part of the spreadsheet might either reinforce your preliminary conclusions about the suitability of the different solution options, or cause you to reconsider your preferences.
Individual scenarios
The lower part of this spreadsheet shows the risk score for each individual requirement. In this case the number and the colour indicate the individual risk score (Impact x Likelihood), and its corresponing colour taken from the Risk Table. Remember, though, that the Likelihood terms have been reversed – here the term is expressing the likelihood that the solution option will satisfactorily address the requirement. So Unlikely will product a worse score than Almost Certain for a given requirement. This table can be useful if you need to ‘drill down’ to find out what was causing a poor combined risk score when examining them by quality characteristic or stakeholder group.
There will be up to 200 rows in this part of the worksheet. To help users pick out the requirements that are of particular interest, the user can select a quality characteristic or a stakeholder (or even a combination of the two) to be highlighted. The effect is that only those requirements that fall within the selected item will be in colour – the other rows lose their colour coding, so that requirements that make up the selected item stand out. It allows a user, for example, to drill into the sources of a particular score for a selected stakeholder and understand which requirement or requirements are causing a certain level of risk.
At this stage, the evaluation team is now in an excellent position to determine which solution option or options are preferred for implementation or, in the case of an analysis of an existing architecture, understand the areas of risk most in need of attention. It is unlikely that any one solution represents a perfect solution, as all practical solutions are likely to contain compromises and trade-offs among ASRs and between quality characteristics. Following this workshop, the team are now better informed about the various trade-offs involved here, and they can select a recommended architecture or design or make changes to an existing architecture knowing the outstanding risks that they will have to manage in the future.
Telling the analysis story
It is also suggested that, whilst an analysis of risk colours and numbers can shed light on the risk landscape, it might be a good idea to create a story out of the trade-off analysis. Many people, such as executives or project steering committee members or senior stakeholders, are more likely to respond to being told a narrative that explains why one solution is preferred, and why none of them is perfect, than being shown a spreadsheet full of numbers and colours. So whilst the spreadsheet holds the details, it also contains the source of a story, and it is this story that should be sought out and articulated to explain the team’s decision or recommendation.