This page explains the differences between “old SARM” and “new SARM”. If you’ve used the original SARM tool, read this to understand how to step up to the new version.
Concepts
The underlying concepts have not changed at all. Risk trade-offs, Stakeholder views, Quality Model perspectives, Cost Benefit analysis: all are still there. What has changed is the way in which risk scores are aggregated when multiple risk scores have to be combined, for example when viewing a solution option from the perspective of a stakeholder.
Removing Averages
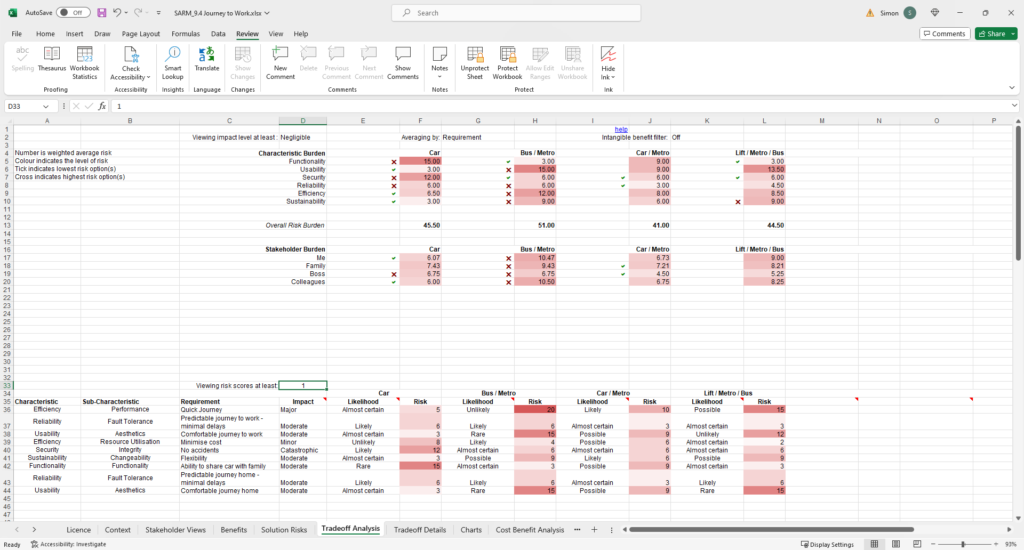
“Old SARM” used a calculated average score when combining the risk scores of multiple requirements. This facilitated comparison between solution options, and between perspectives (e.g. different stakeholders or different quality characteristics). However, the use of an average score is dangerous, and can be misleading. As an individual number, it is meaningless: adding more low scoring risks will cause an average score to fall, yet the most serious risks have not reduced at all, and there is now more risk overall! And the “overall risk burden” is an unweighted average of averages, which also has no meaning in the real world. So whilst the below representation did enable comparison between alternatives within the spreadsheet, the numbers are only of use in comparison with their peers in the same evaluation and cannot be compared with other evaluations which may have a different number of requirements. And the size of the numeric distance between options will vary, in part due to the quantity of requirements involved.

A decision to remove averages from SARM prompts the question, “what to replace them with?”.
A return to the Risk Table
“New SARM” has put the corporate Risk Table at the heart of the tradeoff analysis.

Whilst the risk score calculation in the table has always been there, we’ve reintroduced the Red – Amber – Green (RAG) classification of risks. The whole table is configurable and can be directly edited to adjust the numeric scales, the language and the thresholds that determine the colour classifications. The latter are not just cosmetic – they are used in the Tradeoff Analysis to present individual and aggregated risk scores.
A new way to aggregate risk
SARM relies on aggregating risks and then comparing the results. For example, it will show how the risks associated with a quality characteristic compare across different solution options. So with “Old SARM”, different average scores are displayed for each solution option to represent its risk associated with the Efficiency quality characteristic. In the above example, these are 6.5, 12.0, 8.0 and 8.5 for the four option. The numbers don’t mean much, but a higher score means a higher level of risk, and the relative gaps give some indication of distance. These numbers tell you nothing about their composition – the distribution of the individual risk scores that combine to form the average score.
With “New SARM” we return to the risk table. The system calculates the number of risks scores that fall within each colour category. If there are any Red risks, the cell will be coloured red, and the number will show the count of risks that are classified Red. If there are no Red risks, but at least one Amber risk, the cell will be Amber, again showing how many risks fall within that classification. If there are only Green risks, the cell will be coloured Green and show the total number of risks.

The equivalent view of the Efficiency quality characteristic shows Amber (1), Red (1), Amber (2) and Red (1). So we can see that for this quality characteristic, the first solution option represents the lowest level of risk. This approach is a much better way of allowing the user to understand the worst risks, and how serious they are. A further number follows the coloured cell, shaded grey, that puts those “worst risks” into the context of all the risks that fall within that group. The number represents an aggregate risk score on a logarithmic scale of 1 to 100. Returning to our example, we have scores for Efficiency of 5, 16, 7 and 8. So whilst the 2nd and 4th solutions had a similar colour score (Red (1)), we can see that Option 2 has the worse overall risk score for this group (16 compared with 8).
This combination of using the colour risk table counts and overall context score allows the user to gain an understanding of the distribution of risks within a group of risks by looking at a couple of adjacent cells. The full list of individual risks is still available in a table below, and there is still a Tradeoff Details tab which shows the quality model, including its sub-characteristics, using the same representation.
Simplifying Stakeholder Interest
“Old SARM” required stakeholder interest to be classified by “Strong Interest”, “Interest” or “No Interest”. This allowed the adoption of a weighting to be applied to the average calculation. Now that averages have been removed, there is no use for a weighting, and so the stakeholder interest has been simplified to just “Interest” and “No Interest”. This drives the selection of requirements that make up each stakeholder perspective.
What about the rest?
The approach to Cost Benefit Analysis remains unchanged. The Benefits tab and the Cost Benefit Analysis tab will be familiar to SARM users. The only difference is that the facility to add Non-Financial (intangible) Benefits has been removed. This is because the way they were treated in “Old SARM” was identical to the way that Stakeholder perspectives are now handled. So if you want to explore your options from the perspective of an intangible benefit, you can still do so: just add the intangible benefit as an additional stakeholder and record its “interest” in requirements in the Context worksheet!
We’ve extended the Quality Model to cater for up to 10 quality characteristics. This enables SARM to be used with ISO/IEC 25010:2023 (a new version of the standard’s quality model that contains 9 quality characteristics).
That’s it! SARM now has more numeric integrity than before, but remains a unique way to conduct a risk based trade-off analysis that facilitates evaluation from multiple perspectives: requirements, quality model and stakeholders.

