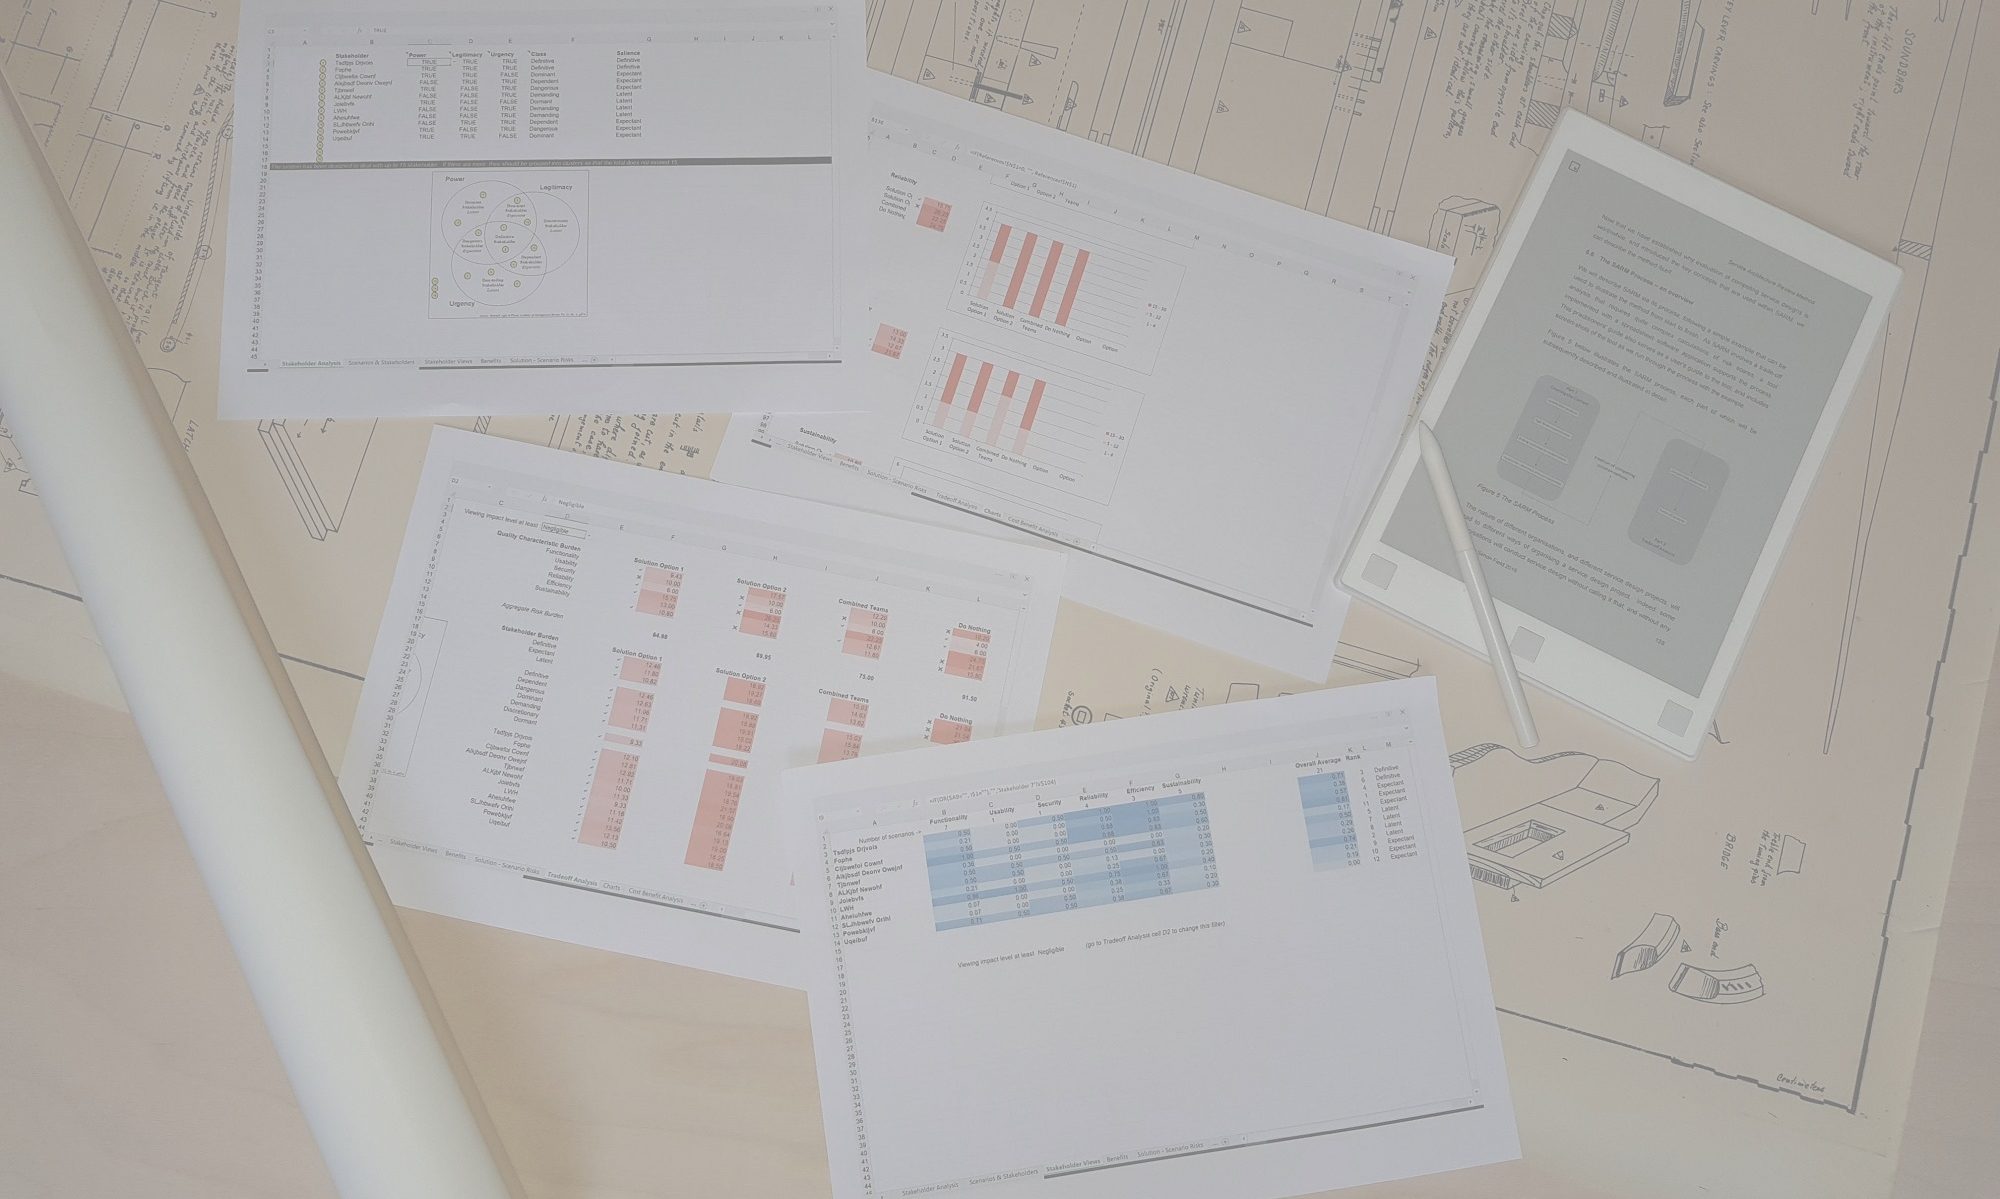
The SARM Process is supported by the SARM Spreadsheet Tool. It is an excel spreadsheet that can be used to document the decisions of the various activities of the two parts of the Process, creating a visual representation of the tradeoff analysis that guides the evaluation team towards their decisions. You can download the tool here, and you can review the software licence agreement here.
The tool can be adapted to suit an organisation’s individual approach to architecture analysis by, for example, changing some aspects and details of the Quality and Risk models that are used. Some guidance on changing these models can be found in the FAQ document.
The tool mirrors the SARM Process with a series of connected tabs or worksheets. Because data gets transferred between worksheets you must not add rows to any of the worksheets. By default, all worksheets are protected, and you should not need to change these settings to use the spreadsheet to complete a SARM analysis, or to adapt the tools to suit the models and language of your organisation. Each worksheet contains a Help link in cell A1 that will take the user to the corresponding help article for that worksheet in the User Guide.
If you expect to use SARM for multiple projects, we recommend that you keep your copy of the downloaded spreadsheet unchanged, and when you begin a new evaluation, just copy the file to a project folder, and give it a new unique name. If you plan to amend the default models, you can create a new ‘master’ copy of your own that retains your new settings.
Once you begin an analysis, start with the first (left-most) tab, and work your way across from left to right, completing fully each worksheet before moving on to the next one. The first tab after the licence agreement contains the Risk Table. If you are used to using a corporate risk model, this table will look familiar to you. You can edit the table to change the numbers and words associated with the five levels of both Impact and Likelihood. Below the main part of the table, you can also specify the thresholds that determine which parts of the table are red, amber and green. Adapting this model to conform to your corporate risk model allows your use of SARM to adopt a language that is already in common use in your enterprise.
You should follow the order of the SARM Process, and you’ll find the order of the tabs mirrors the sequence of activities and the information that is needed to complete each worksheet. The trade-off analysis activity is supported by two tabs: ‘Tradeoff Analysis’ and ‘Tradeoff Details’. After that comes the ‘Cost Benefit Analysis’ tab, which is only used if you decide to engage in a cost benefit analysis alongside your architecture analysis. The ‘References’ tab contains values and models that can be updated if you wish to change the way the SARM tool works to reflect your own modifications to SARM. The two tabs that lie beyond that tab should not be changed – they are used to hold important calculations that contribute to the trade-off analysis tabs enabling them to show risk from the perspectives of quality characteristics, sub-characteristics and stakeholders.
Below, you will find detailed guidance on each of the key tabs or worksheets that you need to use in the tool to complete an evaluation using SARM. You can also access these directly by clicking on ‘help‘ from the relevant worksheet.

