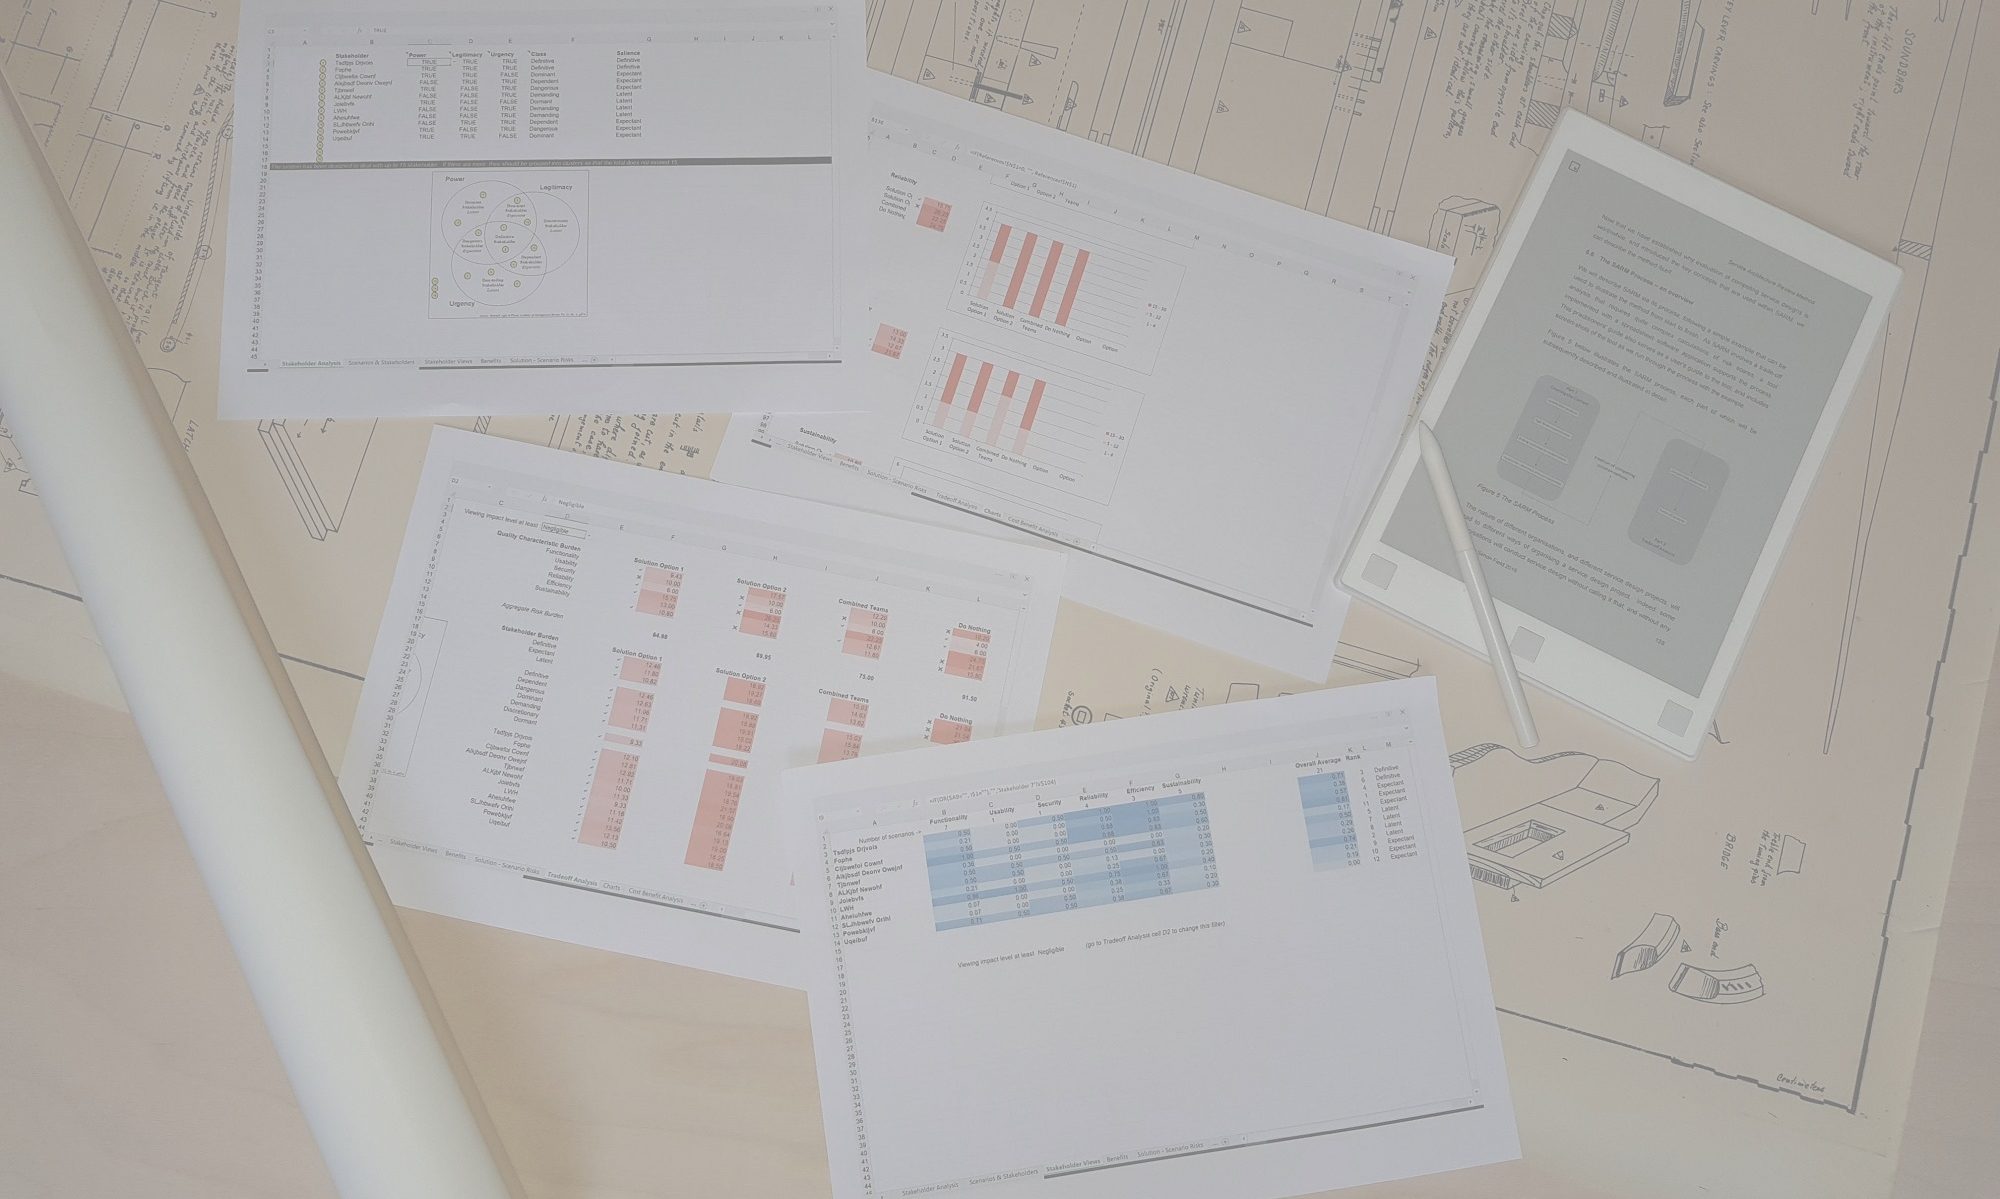
The new version of SARM has now completed a period of testing and refinement, taking account of user feedback, and is now generally available from the SARM Download page. See here for details of how New SARM differs from the old version. For the time being the most recent version of “old SARM” will still be available for download, but it is no longer being developed and in time will be withdrawn from public availability. Old versions of SARM are available on request.
New Version of ISO 25010 released
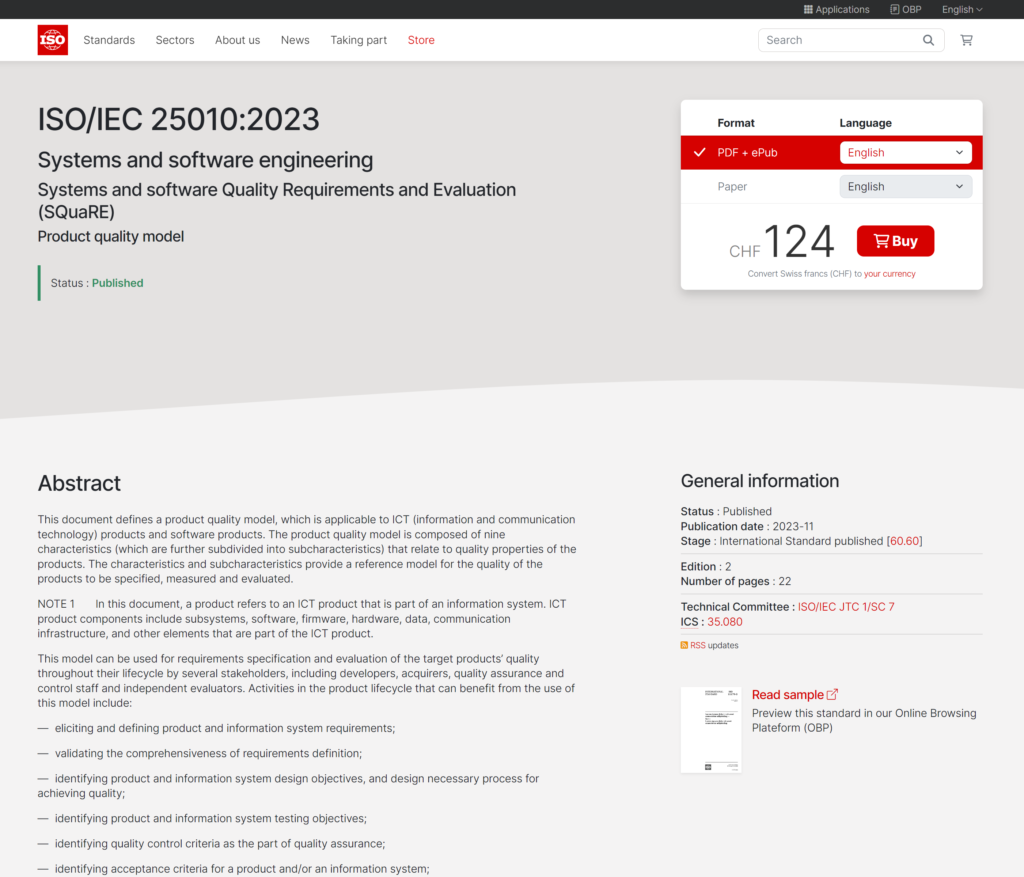
ISO/IEC 25010:2023 is now available. The previous version of the standard contained a “Quality in Use” model as well as a “Product Quality Model”. These have now been split into two licensable standards: the Product Quality model is ISO/IEC 25010:2023, the Quality in Use model is in the new standard: ISO/IEC 25019:2023. It is the Product Quality Model that many SARM users have adopted as their quality model.
The most significant change is that there are now 9 Quality Characteristics in the model, with Safety being the new addition. There has been some renaming of other top level characteristics, and minor changes among the sub-characteristics. For example, Usability is now Interaction Capability. Portability is now Flexibility.

The addition of a 9th characteristic is significant for SARM, as current versions of the spreadsheet tool cater for a quality model consisting of up to 8 characteristics (and up to 25 sub-characteristics per characteristic). There are no plans to extend older versions of SARM to cater for more characteristics. However, the forthcoming “New SARM” will cater for up to 10 characteristics, and so will comfortably cope with the new ISO 25010 prouct quality model. Click here to read more about the improvements being introduced in New SARM.
Welcome
Welcome to the home of the Solution Architecture Review Method (SARM). This page contains the latest news about SARM. You can register to receive periodic updates and news about SARM by submitting your name and email on the right. Go to this page to learn more about SARM.
A new SARM – any beta testers out there?
Ever since developing the SARM spreadsheet tool, I’ve been uncomfortable about its use of a calculated average risk score for aggregating risk. On its own, an average score for risk is almost completely meaningless – a larger number of low risks does not, in any way, diminish the significant of existing high risks. Provided the underlying base is the same, it can provide a decent basis for comparison, which is how it is used in the SARM spreadsheet. But the numbers cannot be compared between different SARM models – the number of requirements/scenarios will affect the spread of average risk scores, so comparison will only be valid within the same model. Anyone who has attended the Architecture Analysis course will be aware of these concerns – I repeatedly warn participants of the danger of looking at average scores.
So I’ve finally decided to explore how best to aggregate risk scores from scenarios to sub-characteristics to characteristics, and to stakeholders and to an overall conclusion, without using averages. I have a good prototype – still excel based. It goes back to the traditional way of using a risk model, with tolerance thresholds determining whether an individual risk score is Red, Amber or Green. The model is defined by the user in a separate tab.
To read more about the differences between “New SARM” and “Old SARM”, click here.
If you want to give it a try, please reach out to me at info [at] sarm [dot] org [dot] uk.
Architecture Analysis training now available
A two-day Architecture Analysis training course, centred around the Solution Architecture Review Method, is now available for delivery on-site. See here for details.
SARM and Agile Architecture
Great to see SARM featured as a valuable method for building quality into the agile software delivery life cycle in this excellent book:
Architecture Analysis
Take a look at this 16-minute long presentation if you’re interested in a short introduction to the general topic of architecture analysis.
SARM 9.0 released
A new version of the SARM spreadsheet tool! The core functionality remains unchanged, but we’ve changed some of the terminology to make it clearer and easier to use, made it easier to accommodate other quality models and, most noticeably, removed the reliance on a stakeholder model.
The reason for this last change is that, whilst the Mitchell, Agle and Wood model is great tool for managing stakeholders, it did not add much value to SARM. It classifies stakeholders according to 7 different classes. SARM focuses on the 15 most significant stakeholders, so the benefit of abstracting from a maximum of 15 stakeholders to 7 classes was negligible. But the value of seeing trade-off analysis from stakeholder perspectives remains huge, and is still a key distinguishing feature of SARM. It is now just a bit easier to either include, or exclude, stakeholder perspectives in your analysis.
For details of the changes, see here. To download version 9.0, go here.
SARM lite
I’ve often been asked whether there is, or should be, a lightweight version of SARM. Something that might be completed in a day, perhaps even just a few hours, which can at least give architects confidence in their decision and provide valuable evidence of the evaluation that was undertaken.
The good news is that “SARM lite” has been here all along! The process, and the tool, will work just as well if you use the bare minimum elements to complete an analysis, leaving the remaining worksheets blank. So if you’re happy to do the evaluation without any cost benefit analysis, skipping being able to explore the effect of different architectures on non-financial benefits, then hide the “Benefits” and “Cost Benefit Analysis” worksheets, leaving them blank.
And if you don’t want to view the trade-off analysis from the perspectives of stakeholders and stakeholder classes, you can also hide the “Stakeholder Analysis” worksheet, leaving that blank too. Although you will still need to define the scenarios in the “Scenarios & Stakeholders” worksheet, the only additional effort needed to complete that step is to categorise each scenario according to the quality model and determine its impact. The big effort of populating the matrix to record stakeholder interest in all the scenarios disappears when there are no stakeholders in the analysis.
With this shortened version, the whole process is reduced to just identifying the scenarios, classifying them and specifying their impact, then you can jump straight to the trade-off analysis by assessing the Solution – Scenario Risks and reviewing the results on the Tradeoff Analysis worksheet. The process could be completed very quickly, but of course you have to know your architecturally significant requirements, and be able to describe your candidate architectures. And perhaps you might miss the added insights you could gain from analysing the stakeholders, costs and benefits!
SARM 8.7 released
Innovative use of SARM, especially of its ability to represent an alternative quality model, has led to some further improvements which are now being passed on in the form of version 8.7 of the spreadsheet tool.
Information to support the tradeoff analysis has been extended with the addition of a new worksheet, “Sub-characteristics”. This follows immediately after the “Tradeoff Analysis” worksheet and it allows the user to compare the risk scores for each solution option by Sub-characteristic. This worksheet will have to be changed to reflect any changes to the default Quality Model, but the changes are simple and instructions have been provided in the User Guide page for the new tab.
Version 8.7 also introduces an alternative mathematical basis on which ‘Quality Characteristic Burden’ risk scores are calculated. In previous versions, these scores were calculated by summing all scenario risk scores that were associated with a given Quality Characteristic, and dividing that total by the number of such scenarios. This approach is still available, and is called “Averaging by Scenario”. The new alternative approach is called “Averaging by Sub-characteristic”. With this approach, the risk burden for a given Quality Characteristic is derived by first calculating the average risk score for each Sub-characteristic that belongs to that Characteristic. These are then averaged. The first method effectively gives equal weight to each scenario within a Characteristic, while the second method gives equal weight to each Sub-characteristic within that Characteristic. You can toggle between the two methods in the Tradeoff Analysis worksheet.
You can request version 8.7 of the spreadsheet tool from the Download page.

