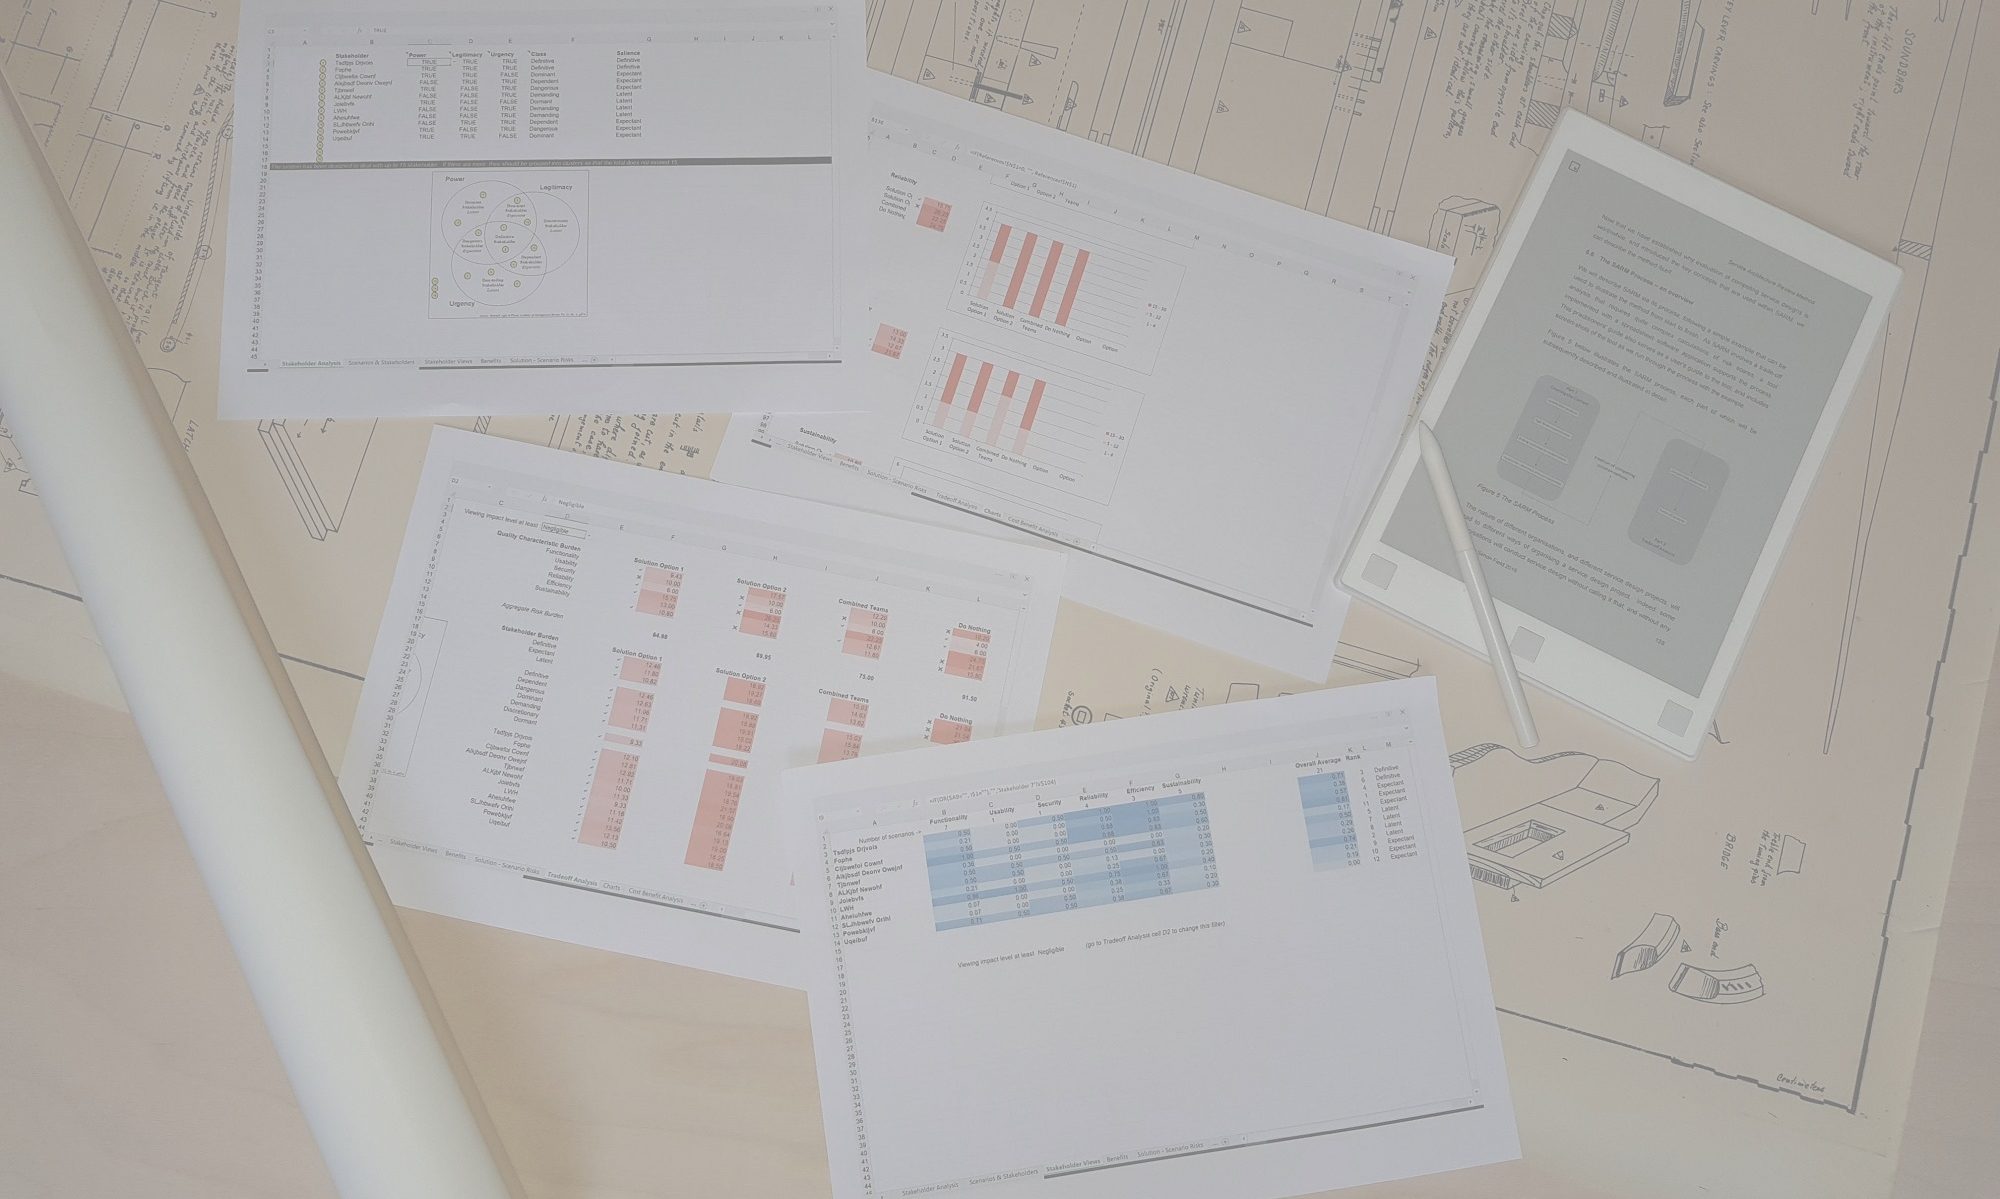
This worksheet contains reference information that is used by the rest of the SARM spreadsheet tool. There is no need to refer to this worksheet if you wish to use the tool ‘out of the box’. However, if you wish to make changes to any of the models or language used in the tool, then this is the worksheet where you can specify your changes. By default this worksheet is fully protected to avoid unintended changes, so if you wish to make changes you will first need to unprotect the worksheet by selecting ‘Unprotect Sheet’ in the Review tab.
Context
The language used to describe the different elements of the context, defined in the ‘Context’ worksheet, is specified in cells B34 to B37. If, you prefer to use the terms Attribute and sub-Attribute instead of Characteristic and sub-Characteristic, you can change them here and those changes will be reflected throughout the spreadsheet. The language of PBAM, for example, would place the words ‘Zone’, ‘Area of Concern’ and ‘Question’ in cells B34, B35 and B36 respectively.
Quality Model
The Quality Model is defined in cells G1 to N27. Row 1 is used to define the names of up to eight Quality Characteristics. If there are fewer than eight, the right-hand column headers should be left blank. Row 2 should be left unchanged, as these names are used in table lookups to populate the drop-down lists in the ‘Context‘ worksheet. Rows 3 to 27 are used to list the sub-characteristics that belong to each Quality Characteristic. These should be listed from the top down.
For the drop-down list of sub-characteristics to work properly, you also need to update ranges specified in the Name Manager. To do this navigate to the Formulas tab in Excel and select the Name Manager (make sure that the worksheet is unprotected before you do this). Select the entry for Characteristic1 and change the cell range in Refers to field so that it corresponds to the list of sub-characteristics for that characteristic. So if, for example, the first characteristic has 5 sub-characteristics, the value in the Refers to field should be “=References!$G$3:$G$7″. Repeat this process in the Name Manager for each of the characteristics and their sub-characteristics.
If you are using version 9.3 or later, Row 28 contains the weight associated with each Quality Characteristic. By default, this is set at 10, thus applying equal weight to each Quality Characteristic. These weights are used in calculating the “Overall Risk Burden” shown in row 13 of the Tradeoff Analysis worksheet. For example, changing the weight of one of the Quality Characteristics from 10 to 20 while leaving the others unchanged will have the effect of applying double weight to that Quality Characteristic in calculating the “Overall Risk Burden” for each solution option.
A change to the Quality Model also demands a change to the ‘Tradeoff Details’ worksheet, which allows users to see tradeoff analysis results by Sub-characteristic. See here for details of how to make these changes.
There is sufficient capacity in the worksheet to change the default SARM Quality Model to those described in, for example, ISO 25010, ISO 25011, Perpsective Based Architecture Method or the SABSA Business Attributes or High Level General Business Attributes models. You should make sure you are licensed to use any new models you choose to adopt with SARM.
Risk Model
The Risk Model is defined in cells B8 to C22, with the Impact dimension defined in cells B8 to C13, and Likelihood in B17 to C22. The B column contains the names of the levels of impact and likelihood, while the C column contains the corresponding numeric values. Cells F12 and F13 automatically calculate the minimum and maximum values of risk impact, and do not need to be changed. These are used to determine the range of colours used when displaying risk values in the ‘Tradeoff Analysis‘, ‘Tradeoff Details‘ and ‘Charts‘ worksheets.
If you change either Impact or Likelihood you must make sure that there are no entries in the ‘Context’ or ‘Solution Risks’ worksheets containing the old values. And if you change the Impact values, check cell D2 in the ‘Tradeoff Analysis’ worksheet to make sure that the value in that cell is among the new Impact values. If it is not, the tool will fail to show any risk values, and will fill with strange symbols!
Cost Benefit Analysis
You can also change the way in which the optional cost benefit analysis works in this worksheet. Changes here will affect the ‘Benefits‘ and ‘Cost Benefit Analysis‘ worksheets. Cells B43 to B45 contain the three options that are presented to the user in the dropdown list in cell F5 of the ‘Benefits’ worksheet.
Cells D18 to D22 determine the relationship between the Estimated Benefit and the Maximum Benefit for each scenario / solution option combination according to the likelihood of that solution option being able to achieve the given scenario satisfactorily.
Cells B29 to C31 determine the Exit Difficulty options that are presented in the dropdown list for each solution option in the costs section of the ‘Cost Benefit Analysis’ worksheet, and their corresponding increase to the Development cost.

